Should We Fear the Surge in Cash-Out Refinances?
Posted on: March 23, 2021

Freddie Mac recently released their Quarterly Refinance Statistics report which covers refinances through 2020. The report explains that the dollar amount of cash-out refinances was greater in 2020 than in recent years. A cash-out refinance, as defined by Investopia, is:
“a mortgage refinancing option in which an old mortgage is replaced for a new one with a larger amount than owed on the previously existing loan, helping borrowers use their home mortgage to get some cash.”
The Freddie Mac report led to articles like the one published by The Real Deal titled, House or ATM? Cash-Out Refinances Spiked in 2020, which reports:
“Americans treated their homes like ATMs last year, withdrawing $152.7 billion amid a cash-out refinancing spree not seen since before the 2008 financial crisis.”
Whenever you combine the terms “spiked,” “homes like ATMs,” and “financial crisis,” it conjures up memories of the housing crash we experienced in 2008.
However, that comparison is invalid for three reasons:
1. Americans are sitting on much more home equity today.
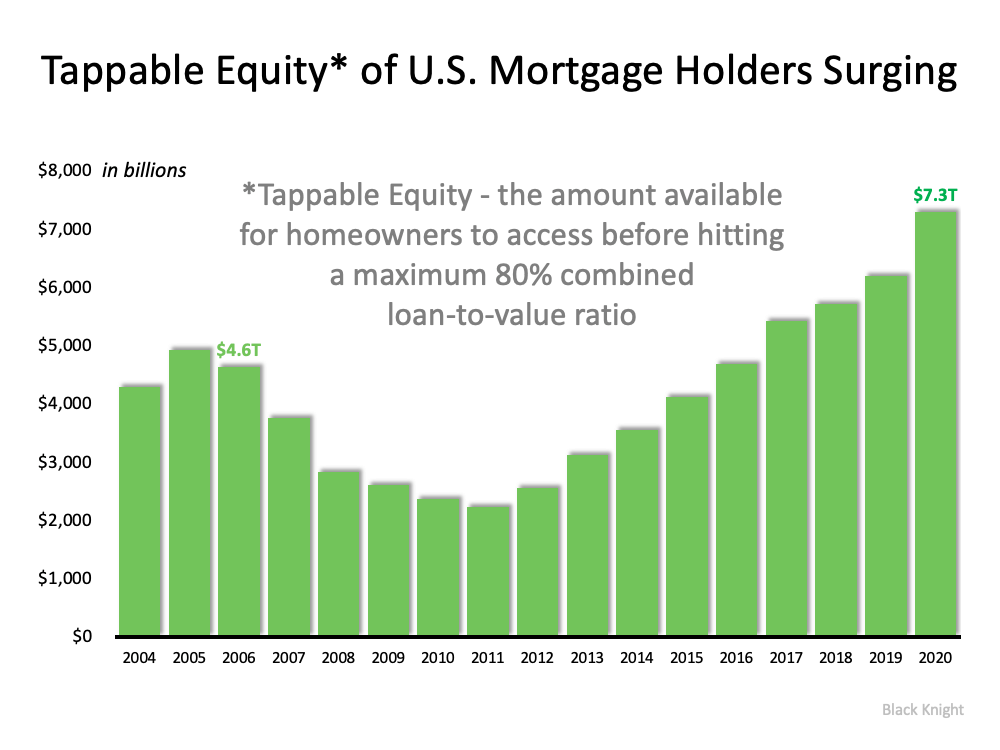
Mortgage data giant Black Knight just issued information on the amount of tappable equity U.S. homeowners with a mortgage have. Tappable equity is the amount of equity available for homeowners to use and still have 20% equity in their home. Here’s a graph showing the findings from their report:

In 2006, directly before the crash, tappable home equity in the U.S. topped out at $4.6 trillion. Today, that number is $7.3 trillion.
As Black Knight explains:
“At year’s end, some 46 million homeowners held a total $7.3 trillion in tappable equity, the largest amount ever recorded…That’s an increase of more than $1.1 trillion (+18%) since the end of 2019, the largest percentage gain since 2013 and – you guessed it – the largest dollar value gain in history, to boot. All in all, it works out to roughly $158,000 on average per homeowner with tappable equity, up nearly $19,000 from the end of 2019.”
2. Homeowners cashed-out a much smaller amount this time.
In 2006, Americans cashed-out a total of $321 billion. In 2020, that number was less than half, totaling $153 billion. The $321 billion made up 7% of the total tappable equity in the country in 2006. On the other hand, the $153 billion made up only 2% of the total tappable equity last year.
3. Fewer homeowners tapped their equity in 2020 than in 2006.
Freddie Mac reports that 89% of refinances in 2006 were cash-out refinances. Last year, that number was less than half at 33%. As a percentage of those who refinanced, many more Americans lowered their equity position fifteen years ago as compared to last year.
Bottom Line
It’s true that many Americans liquidated a portion of the equity in their homes last year for various reasons. However, less than half of them tapped their equity compared to 2006, and they cashed-out less than one-third of that available equity. Today’s cash-out refinance situation bears no resemblance to the situation that preceded the housing crash.
